From EurekAlert! Public Release: 17-Jan-2019 Seafloor predators and open-water feeding animals will benefit from climate change, while those associated with sea ice for food or breeding are most at risk Frontiers Marine Antarctic animals closely associated with sea ice for food or breeding, such the humpback whale and emperor penguin, are most at risk from…
from Climate Change Skeptic Blogs via hj on Inoreader http://bit.ly/2S2PVWk
Saturday, January 19, 2019
Penguins, starfish, whales: Which animals will win and lose in a warming Antarctic?
Light-absorbing impurities in snow of the Indian Western Himalayas: impact on snow albedo, radiative forcing, and enhanced melting
Abstract
Seasonal snow cover in the Himalayas acts as source of fresh water for several Asian rivers such as Indus, Ganges, Brahmaputra, and Yangtze. Early loss of seasonal snow exposes the ice layer of the glaciers directly to sunlight, consequently leading to their ablation and alterations in discharge of glacier-fed rivers. Therefore, any alteration in the melting rate of the Himalayan snow pack can significantly affect the ecological balance in the region. Besides global warming, enhanced melting of snow, caused by light-absorbing impurities (LAIs) such as dust and elemental carbon (EC), has also been recognized as prominent cause of enhanced melting of snow in the Himalayas of China and Nepal. However, in light of vast area of the Himalayas and persistent emissions from India, studies, emphasizing the potential of LAIs to substantially affect the snow radiation budget of snow cover in IWHs, are still scanty. Therefore, in this study, field campaigns were made on three glaciers, i.e., Hamta, Beas Kund, and Deo Tibba, in IWHs to collect snow samples for estimation of LAIs. Snow of the studied glaciers was observed to be contaminated with 13.02 to 74.57 ng/g of EC and 32.14 to 216.54 μg/g of dust. Albedo simulations done using SNow and ICe Aerosol Radiation (SNICAR) model indicated that besides the changes caused by increased grain size, EC and dust, cumulatively induced 0.60 to 32.65% reduction in albedo of snow. Further assessment, constrained by measurements, illustrated that radiative forcing (RF), of 1.8 to 80 W/m2, was instigated due to enhanced thermal absorption of snow. Ten hours of daily mean RFs in this range could correspond to 3 to 9.65 mm/d of snow melt and contribute significantly in reducing the seasonal snow cover in IWHs. Considering the consequences of LAIs-induced snow melt and lack of in situ observations in the IWHs, the outcomes of this study could assist researchers and policy makers in developing efficient climate models and framing mitigation measures, respectively.
from Climate Change Skeptic Blogs via hj on Inoreader http://bit.ly/2TWR3bc
Watch: CA Electricity Flame Out – ‘California will be picking up most of the tab for their state’s energy mismanagement’
Clear Energy Alliance Published on Jan 18, 2019 Due to recent wildfires in California, PG&E is going up in flames. The utility is filing for bankruptcy, and while many are blaming man-caused climate change, it's not the villain in this horror story. VISIT Clear Energy Alliance http://bit.ly/2CzzqXN FOLLOW us! Facebook: https://www.facebook.com/ClearEnergyA… Twitter: https://twitter.com/clearenergy Instagram: https://www.instagram.com/clearenergy… [...]
from Climate Change Skeptic Blogs via hj on Inoreader http://bit.ly/2RBlCGP
So what does “climate justice” have to do with women’s rights and pussyhats?

from Climate Change Skeptic Blogs via hj on Inoreader http://bit.ly/2FDOVBT
NO EVIDENCE’: Experts Continue To Debunk WaPo’s Claim About The Shutdown And Weather Forecasts

from Climate Change Skeptic Blogs via hj on Inoreader http://bit.ly/2U0Hc4b
WE HAVE A WINNER: CLIMATE’S TALLEST TALE 2018 – ‘Climate change’ allegedly causing blue whales to ‘sing louder as they struggle to be heard over breaking sea ice”
http://bit.ly/2U2VAsB GWPF We asked you to nominate the wackiest climate stories of the year. You didn't let us down. Before Christmas, we asked GWPF readers to send us nominations for our search to find the tallest climate tale of 2018. It's fair to say that there was a lot of competition, with the catastrophe mongers [...]
from Climate Change Skeptic Blogs via hj on Inoreader http://bit.ly/2DmKHfG
Synthesis and characterization of exfoliated biochar from four agricultural feedstock
Abstract
Highly porous biochar (BC) structures have been prepared from inexpensive biomasses like rice straw, bamboo, sugarcane waste, and corn cob via a slow pyrolysis technique in nitrogenous atmosphere. A surface engineering technique has been applied to enhance the surface-to-volume ratio of each biochar sample and finally compared its characteristics through standard surface and elemental characterization techniques, viz. CHN (carbon, hydrogen, and nitrogen), FTIR (Fourier transform infrared spectroscopy), BET (Brunauer–Emmett–Teller), and SEM (scanning electron microscopy). All the biochar samples were observed to be highly carbonized and aromatized. Exfoliated structures were found to contain more elemental carbon (34.14–77.32%) than its native form (30.92–74.46%). Aromatic hydrocarbon, aromatic C=C, aromatics, aliphatic C–O, aliphatic hydrocarbon, and H-bonded OH groups were found to predominate in the surface of biochar structures independent of their precursor composition and extent of exfoliation. SEM micrographic images clearly ensured about the unoriented sheets like the morphology of different biochar samples. Although no significant structural difference was found to exist depending on their precursor compositions, quantitative enhancement of porosity was found to be observed after exfoliation. Both native (240.65 m2/g) and exfoliated (712.89 m2/g) biochars derived from sugarcane wastes were observed to have a maximum surface area in comparison to the biochars derived from rice straw (native, 22.08 m2/g; exfoliated, 29.92 m2/g), bamboo (native, 42.08 m2/g; exfoliated, 248.38 m2/g), and corn cob (native, 136.62 m2/g; exfoliated, 221.71 m2/g). Exfoliated biochars were found to be consistently more potent in comparison to its native form as per our comparative characterizations performed so far.
from Climate Change Skeptic Blogs via hj on Inoreader http://bit.ly/2FBa003
US Taxpayers Paid $329,000 for this Useless DoD Climate Report

from Climate Change Skeptic Blogs via hj on Inoreader http://bit.ly/2U3ROPL
Waves in Saturn’s rings give precise measurement of planet’s rotation rate
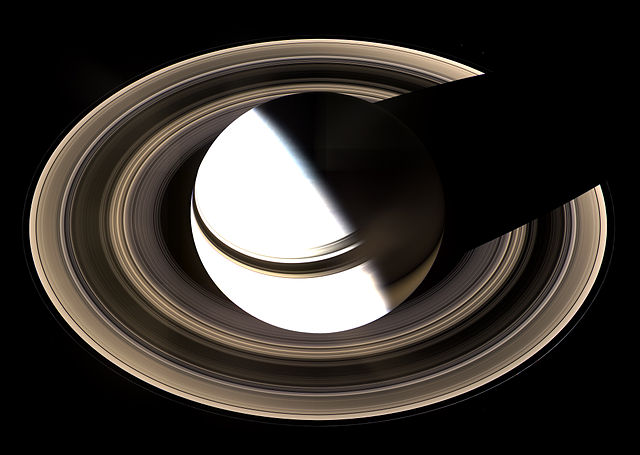
Saturn from the Cassini orbiter [image credit: NASA]
This has been a tricky problem for years as explained below, and now appears to have been resolved. But whether that's the end of the story remains to be seen.
Saturn's distinctive rings were observed in unprecedented detail by NASA's Cassini spacecraft, and scientists have now used those observations to probe the interior of the giant planet and obtain the first precise determination of its rotation rate, reports Phys.org.
The length of a day on Saturn, according to their calculations, is 10 hours 33 minutes and 38 seconds.
The researchers studied wave patterns created within Saturn's rings by the planet's internal vibrations. In effect, the rings act as an extremely sensitive seismograph by responding to vibrations within the planet itself.
Similar to Earth's vibrations from an earthquake, Saturn responds to perturbations by vibrating at frequencies determined by its internal structure. Heat-driven convection in the interior is the most likely source of the vibrations. These internal oscillations cause the density at any particular place within the planet to fluctuate, which makes the gravitational field outside the planet oscillate at the same frequencies.
"Particles in the rings feel this oscillation in the gravitational field. At places where this oscillation resonates with ring orbits, energy builds up and gets carried away as a wave," explained Christopher Mankovich, a graduate student in astronomy and astrophysics at UC Santa Cruz.
Mankovich is lead author of a paper, published January 17 in the Astrophysical Journal, comparing the wave patterns in the rings with models of Saturn's interior structure.
Most of the waves observed in Saturn's rings are due to the gravitational effects of the moons orbiting outside the rings, said coauthor Jonathan Fortney, professor of astronomy and astrophysics at UC Santa Cruz. "But some of the features in the rings are due to the oscillations of the planet itself, and we can use those to understand the planet's internal oscillations and internal structure," he said.
Mankovich developed a set of models of the internal structure of Saturn, used them to predict the frequency spectrum of Saturn's internal vibrations, and compared those predictions with the waves observed by Cassini in Saturn's C ring. One of the main results of his analysis is the new calculation of Saturn's rotation rate, which has been surprisingly difficult to measure.
As a gas giant planet, Saturn has no solid surface with landmarks that could be tracked as it rotates. Saturn is also unusual in having its magnetic axis nearly perfectly aligned with its rotational axis. Jupiter's magnetic axis, like Earth's, is not aligned with its rotational axis, which means the magnetic pole swings around as the planet rotates, enabling astronomers to measure a periodic signal in radio waves and calculate the rotation rate.
The rotation rate of 10:33:38 determined by Mankovich's analysis is several minutes faster than previous estimates based on radiometry from the Voyager and Cassini spacecraft.
Continued here.
from Climate Change Skeptic Blogs via hj on Inoreader http://bit.ly/2FyoZaQ
Arctic Icing on All Sides Now

With the usual fits and starts, the Arctic has now frozen solid in the central and Russian basins, and ice extents are recovering on all sides, Pacific, European and Canadian. The laggards have been Kara and Barents Seas, but progress there is shown below.
Kara on the left is virtually iced over, while Barents ice has reached out to claim the eastern coast of Svalbard in the center. On the right Greenland Sea ice is extending toward Iceland. Compared to 2018 March maximums, Kara is 99%, Greenland Sea is 98% and Barents is 60% of maximum. The image below shows 2019 ice recovery on the Canadian side.
Upper left is Greenland sea ice reaching toward Iceland. In the center Baffin Bay is growing ice southward down the Greenland coast. On the right, ice extent has grown along Labrador to touch Newfoundland, and start filling in the Gulf of St. Lawrence. Baffin Bay/Gulf St. Lawrence is now 70% of 2018 March max, which was one of the higher extent years for that basin. Finally we return below to the Pacific ice recovery.

As reported previously, ice extent has rebounded here coinciding with the dissipating warm water Blob in North Pacific. Bering Sea on the right started first and is now 17% greater than maximum last March. Okhotsk sea ice has picked up the pace and is now 58% of March max.

In January, 2018 ice extents tracked the 12 year average (2007 to 2018 inclusive), at times pausing and then surging. SII 2019 is showing slightly less ice, averaging 100k km2 lower. As of yesterday, this year has gained about 500k km2 more ice than either 2017 or 2018.
from Climate Change Skeptic Blogs via hj on Inoreader http://bit.ly/2W4wAD2
When environmentalism becomes corruption – Part 1

from Climate Change Skeptic Blogs via hj on Inoreader http://bit.ly/2T91VTv
Ocean SSTs Cooler in December
Note: A drogue is a sea anchor resisting drifting speed.
The best context for understanding decadal temperature changes comes from the world's sea surface temperatures (SST), for several reasons:
- The ocean covers 71% of the globe and drives average temperatures;
- SSTs have a constant water content, (unlike air temperatures), so give a better reading of heat content variations;
- A major El Nino was the dominant climate feature in recent years.
HadSST is generally regarded as the best of the global SST data sets, and so the temperature story here comes from that source, the latest version being HadSST3. More on what distinguishes HadSST3 from other SST products at the end.
The Current Context
The chart below shows SST monthly anomalies as reported in HadSST3 starting in 2015 through December 2018.
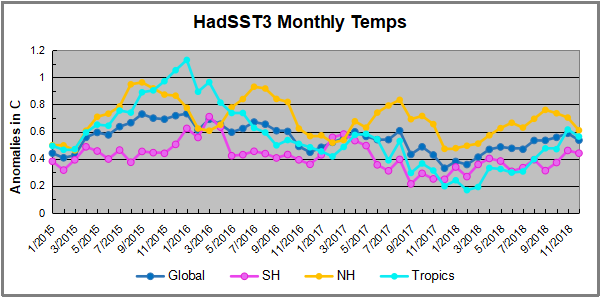
A global cooling pattern is seen clearly in the Tropics since its peak in 2016, joined by NH and SH cycling downward since 2016. 2018 started with slow warming after the low point of December 2017, led by steadily rising NH, which peaked in September and cooled the last 3 months. The Tropics have risen steadily since July, and along with a bump in SH pulled the Global anomaly up slightly, peaking in November.
The December Global anomaly is higher than 2017 but still lower than 2015. Similarly, NH, SH and the Tropics are all slightly higher than 2017, but still lower than 12/2015. The rise in the Tropics is likely due to the weak El Nino, maybe also affecting the SH, but has now backed down.
Note that higher temps in 2015 and 2016 were first of all due to a sharp rise in Tropical SST, beginning in March 2015, peaking in January 2016, and steadily declining back below its beginning level. Secondly, the Northern Hemisphere added three bumps on the shoulders of Tropical warming, with peaks in August of each year. A fourth NH bump was lower and peaked in September 2018. Also, note that the global release of heat was not dramatic, due to the Southern Hemisphere offsetting the Northern one.
The annual SSTs for the last four years are as follows:
| Annual SSTs | Global | NH | SH | Tropics |
| 2014 | 0.477 | 0.617 | 0.335 | 0.451 |
| 2015 | 0.592 | 0.737 | 0.425 | 0.717 |
| 2016 | 0.613 | 0.746 | 0.486 | 0.708 |
| 2017 | 0.505 | 0.650 | 0.385 | 0.424 |
| 2018 | 0.480 | 0.620 | 0.362 | 0.369 |
2018 annual average SSTs across the regions are close to 2015, slightly higher in SH and much lower in the Tropics. The SST rise from the global ocean was remarkable, peaking in 2016, higher than 2011 by 0.32C.
A longer view of SSTs
The graph below is noisy, but the density is needed to see the seasonal patterns in the oceanic fluctuations. Previous posts focused on the rise and fall of the last El Nino starting in 2015. This post adds a longer view, encompassing the significant 1998 El Nino and since. The color schemes are retained for Global, Tropics, NH and SH anomalies. Despite the longer time frame, I have kept the monthly data (rather than yearly averages) because of interesting shifts between January and July.
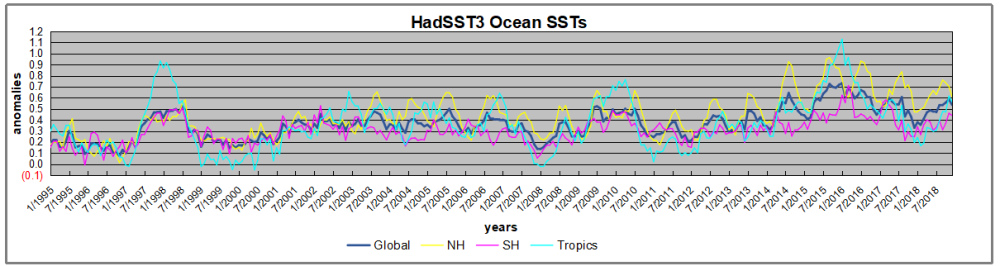 1995 is a reasonable starting point prior to the first El Nino. The sharp Tropical rise peaking in 1998 is dominant in the record, starting Jan. '97 to pull up SSTs uniformly before returning to the same level Jan. '99. For the next 2 years, the Tropics stayed down, and the world's oceans held steady around 0.2C above 1961 to 1990 average.
Then comes a steady rise over two years to a lesser peak Jan. 2003, but again uniformly pulling all oceans up around 0.4C. Something changes at this point, with more hemispheric divergence than before. Over the 4 years until Jan 2007, the Tropics go through ups and downs, NH a series of ups and SH mostly downs. As a result the Global average fluctuates around that same 0.4C, which also turns out to be the average for the entire record since 1995.
2007 stands out with a sharp drop in temperatures so that Jan.08 matches the low in Jan. '99, but starting from a lower high. The oceans all decline as well, until temps build peaking in 2010.
Now again a different pattern appears. The Tropics cool sharply to Jan 11, then rise steadily for 4 years to Jan 15, at which point the most recent major El Nino takes off. But this time in contrast to '97-'99, the Northern Hemisphere produces peaks every summer pulling up the Global average. In fact, these NH peaks appear every July starting in 2003, growing stronger to produce 3 massive highs in 2014, 15 and 16. NH July 2017 was only slightly lower, and a fifth NH peak still lower in Sept. 2018. Note also that starting in 2014 SH plays a moderating role, offsetting the NH warming pulses. (Note: these are high anomalies on top of the highest absolute temps in the NH.)
What to make of all this? The patterns suggest that in addition to El Ninos in the Pacific driving the Tropic SSTs, something else is going on in the NH. The obvious culprit is the North Atlantic, since I have seen this sort of pulsing before. After reading some papers by David Dilley, I confirmed his observation of Atlantic pulses into the Arctic every 8 to 10 years.
But the peaks coming nearly every summer in HadSST require a different picture. Let's look at August, the hottest month in the North Atlantic from the Kaplan dataset.
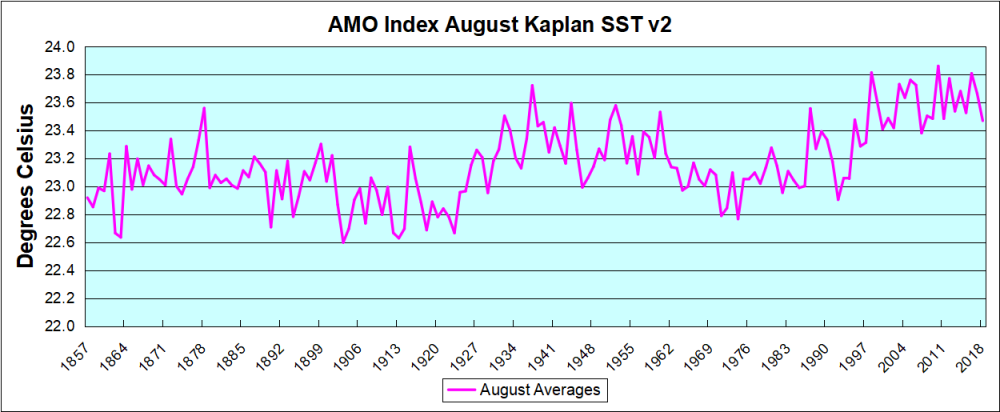
The AMO Index is from from Kaplan SST v2, the unaltered and not detrended dataset. By definition, the data are monthly average SSTs interpolated to a 5×5 grid over the North Atlantic basically 0 to 70N. The graph shows warming began after 1992 up to 1998, with a series of matching years since. Because the N. Atlantic has partnered with the Pacific ENSO recently, let's take a closer look at some AMO years in the last 2 decades.
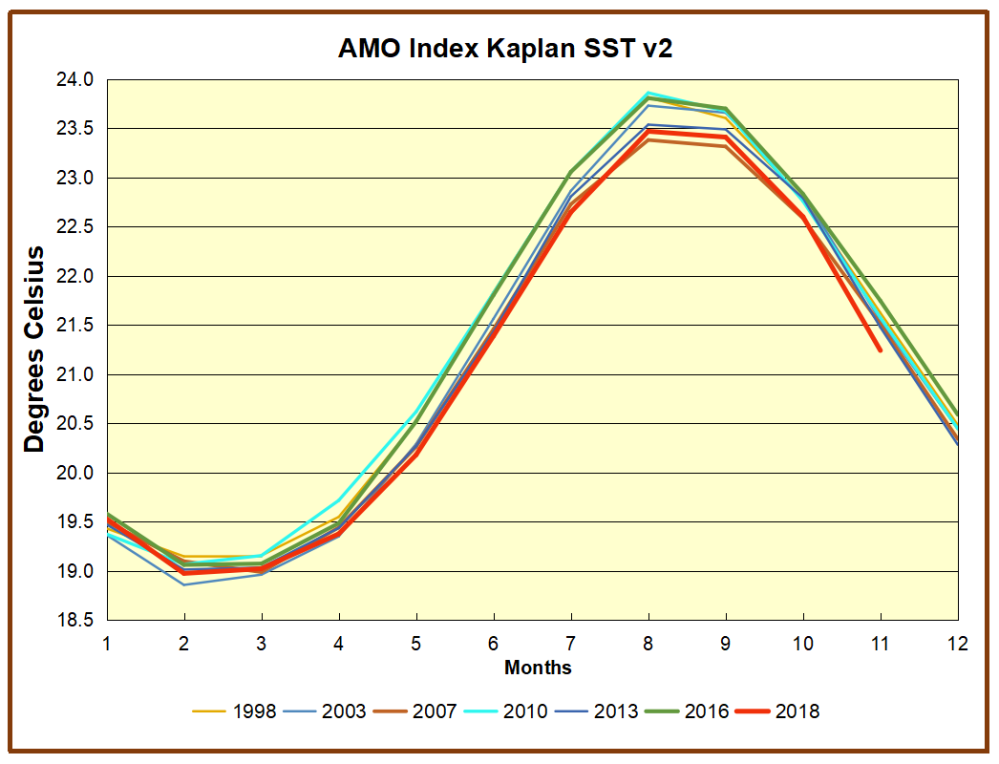
This graph shows monthly AMO temps for some important years. The Peak years were 1998, 2010 and 2016, with the latter emphasized as the most recent. The other years show lesser warming, with 2007 emphasized as the coolest in the last 20 years. Note the red 2018 line is at the bottom of all these tracks. Most recently November 2018 is 0.50C lower than November 2016, and is the coolest November since 2011.
Summary
The oceans are driving the warming this century. SSTs took a step up with the 1998 El Nino and have stayed there with help from the North Atlantic, and more recently the Pacific northern "Blob." The ocean surfaces are releasing a lot of energy, warming the air, but eventually will have a cooling effect. The decline after 1937 was rapid by comparison, so one wonders: How long can the oceans keep this up? If the pattern of recent years continues, NH SST anomalies will likely cool in coming months. Once again, ENSO will probably determine the outcome.
Postscript:
In the most recent GWPF 2017 State of the Climate report, Dr. Humlum made this observation:
"It is instructive to consider the variation of the annual change rate of atmospheric CO2 together with the annual change rates for the global air temperature and global sea surface temperature (Figure 16). All three change rates clearly vary in concert, but with sea surface temperature rates leading the global temperature rates by a few months and atmospheric CO2 rates lagging 11–12 months behind the sea surface temperature rates."
Footnote: Why Rely on HadSST3
HadSST3 is distinguished from other SST products because HadCRU (Hadley Climatic Research Unit) does not engage in SST interpolation, i.e. infilling estimated anomalies into grid cells lacking sufficient sampling in a given month. From reading the documentation and from queries to Met Office, this is their procedure.
HadSST3 imports data from gridcells containing ocean, excluding land cells. From past records, they have calculated daily and monthly average readings for each grid cell for the period 1961 to 1990. Those temperatures form the baseline from which anomalies are calculated.
In a given month, each gridcell with sufficient sampling is averaged for the month and then the baseline value for that cell and that month is subtracted, resulting in the monthly anomaly for that cell. All cells with monthly anomalies are averaged to produce global, hemispheric and tropical anomalies for the month, based on the cells in those locations. For example, Tropics averages include ocean grid cells lying between latitudes 20N and 20S.
Gridcells lacking sufficient sampling that month are left out of the averaging, and the uncertainty from such missing data is estimated. IMO that is more reasonable than inventing data to infill. And it seems that the Global Drifter Array displayed in the top image is providing more uniform coverage of the oceans than in the past.

USS Pearl Harbor deploys Global Drifter Buoys in Pacific Ocean
from Climate Change Skeptic Blogs via hj on Inoreader http://bit.ly/2CsUXkW
Paris Agreement Fan Laments Massive Fossil Fuel Powered Industrialisation in Bangladesh

from Climate Change Skeptic Blogs via hj on Inoreader http://bit.ly/2HlIncY
Weekend Unthreaded
…
Rating: 0.0/10 (0 votes cast)
Rating: 0.0/10 (0 votes cast)
from Climate Change Skeptic Blogs via hj on Inoreader http://bit.ly/2ATD66R
Tomorrow’s Total Lunar Eclipse, and a Mystery
Tomorrow night (January 20-21) will present the whole U.S. with a total lunar eclipse, the best one until May 15, 2022.
Totality here in Alabama will occur approximately from 10:40 to 11:40 p.m. CST. Clear weather will be restricted mostly to the southeastern U.S., and portions of the Northern Plains and Great Lakes:

A Mystery (to me, anyway)
There's one aspect of the eclipse I cannot figure out. I'm sure the explanation will be simple, and when someone explains it to me, my response will be, "DOH!".
The illumination of the moon during totality is due to light scattered through Earth's atmosphere. Just as we see red sunsets, that red light will be shining on the moon from an annulus of red sunset light circling the Earth.
What I don't understand, though, is the role of sunlight refraction (bending of sunlight) as it passes through the atmosphere at an oblique angle. The refraction occurs whether it is the moon or the sun being viewed through the limb, and I will use the example moonlight shining through the limb.
My understanding is that light (from either the moon or sum) bends as I crudely show in the following cartoon. The "mystery" arises from the fact that we know that the appearance of the moon is that it is flattened due to refraction:

The moon composite photo is from the ISS, so it is exactly analogous to the situation shown in the drawing.
So, the mystery: Why is the moon flattened rather elongated? I simply don't know. But I'm sure the explanation is simple.
from Climate Change Skeptic Blogs via hj on Inoreader http://bit.ly/2W1RgLX
Slowing Down For The Climate: German Evangelical Church Petitioning For Speed Limit On ‘Autobahns’
The days of unlimited speed on Germany's famed autobahns are indisputably coming to an end – probably soon. And thank God!
Hat-tip: achgut.com.
The online Mitteldeutche Zeitung MZ) here reports the Evangelical Church in Central Germany (EKM) is pushing to impose a speed limit on German autobahns, the motorways where drivers in certain stretches are free to drive as fast as they dare.

The days of no speed limit on Germany's famed autobahns are about to end. Photo: Darkone, CC BY-SA 2.5, (Wikipedia)
#/media/File:A_20_bei_Langsdorf.jpg)
Quoting Christian Fuhrmann of the EKM, the MZ reports that cars should she limited to 130 km/hr and the Church will mobilize to send a public petition to the German Bundestag.
The MZ adds that the petition will be launched on Ash Wednesday and 50,000 signatures are needed.
According to the MZ: "The Central German Church covers large parts of Saxony-Anhalt and Thuringia and has about 700,000 members."
The Church's main reason for limiting the speed of cars to 130 km/hr on the autobahn is to reduce greenhouse gas emissions and exhaust fumes, which the Church says would translate to an emissions reduction of 2 – 2.5%. Also the high speeds and associated braking leads to more fine particle emissions from tire abrasion on asphalt surfaces, as well as more noise.
"A Confession to the Creator"
The MZ also reports that potential CO2 savings could be 2 million tonnes annually. Currently Germany emits some 900 million tonnes of CO2 equivalent gases annually.
The MZ adds:
"We see a world responsibility for ourselves, assigned by God," said state bishop Ilse Junkermann. Mankind is destroying the foundations of life. The fight against it is "a confession to the Creator".
Makes sense from safety alone
Personally I support a 130 km/hr limit, but not because of the silly climate reasons. Overall a limit is far safer, and some studies show it would likely improve over traffic flow efficiency and help reduce long traffic jams, which often result from messy car accidents. In the end less traffic jams means reaching your destination just as quickly as you would madly driving at breakneck speeds.
Also an autobahn speed limit could mean lower maintenance costs because the surface specifications for unevenness could be relaxed a bit. Any unevenness really becomes a factor when a vehicle is flying at 280 km/hr. With speeds at 130 km/hr, road crews would not have to be sent out to "repair" the road, which in turn means lane closures and again more traffic obstruction and slowdown.
One compromise could be to tolerate speeds of 160 km/hr (100 mph) during times and areas of light traffic.
from Climate Change Skeptic Blogs via hj on Inoreader http://bit.ly/2U5fVh7
This Week In Doom — Manliness Is Now A Sickness Edition
Item The APA now defines manliness as a mental malady.
The link below will take you to the new APA guidance document that defines "traditional masculinity" as unhealthy for men. I encourage you to read it and to evaluate its arguments & suggestions. This matters and I will explain why. https://t.co/1KAwizWfQy
— John P Wright (@cjprofman) January 7, 2019
You wondered what the practical effects of SJWs taking over universities would be. Well, this is as practical as it gets. Since it's the professional psychological organizations that get to say what's nuts and what isn't, and professionals are mostly lodged in social justice towers, isolated from Reality, whatever they say goes. All the higher authorities, like lawmakers and judges rely on what they say. Try getting a word otherwise into their journals. And if you can't get a word in, what you say doesn't count, not professionally.
Wright: "Reading through the document you will also see how these terms are connected to the broader feminist conception of patriarchy. Men benefit from, and are victimized by, this omnipotent invisible force that magically shapes their lives."
The ideology that appears to be driving the academic shrinks is toxic feminism.
Wright (ellipsis original):
I could go on but I want to turn to the consequences of labeling traditional men as toxic. Understand that this document carries the weight of scientific authority. It will be used in the training of clinical psychologists, it will be used to justify programs that target boys who show signs of impending traditional masculinity, and it will be used to justify restrictive policies towards men. Think of how universities, especially the diversity czars, will use this, how the courts will use this in custody hearings, and how workplace training and policies will be affected. The @APA has, in essence, justified… no, it has encouraged, discrimination against men who hold traditional views of masculinity.
Link to APA report.
You laughed when I suggested dropping large rocks from space on colleges, but if we don't now defund, depopulate, and delegitimize our traditional higher educational system now, we're soon going to be in really deep kimchi. Because nobody knows how or has the guts to say no to SJWs.
from Climate Change Skeptic Blogs via hj on Inoreader http://bit.ly/2FLtdvi
Solar Climate Connection and Cosmic Rays
.
.
A look at possible implications of current and continuing low solar activity.
The is a very interesting 40-minute video presentation by Nir Shaviv on the solar-climate connection and cosmic rays.
Shaviv first presents the evidence that the sun affects climate before explaining the cosmic ray ideas.
from Climate Change Skeptic Blogs via hj on Inoreader http://bit.ly/2W3CuEv
Seed priming with silicon nanoparticles improved the biomass and yield while reduced the oxidative stress and cadmium concentration in wheat grains
Abstract
Cadmium (Cd) is among the non-essential elements for the growth of crops while silicon (Si) is a beneficial element for plant growth. There is little evidence regarding the use of silicon nanoparticles (Si NPs) on the reduction of Cd accumulation in crops especially wheat. The present study determined the impact of seed priming with Si NPs on Cd-induced responses in wheat in terms of growth, yield, photosynthesis, oxidative stress, and Si and Cd accumulation in wheat. Seed priming was done by different levels of Si NPs (0, 300, 600, 900, 1200 mg/L) for 24 h by providing continuous aeration. Afterwards, seeds were sown in soil contaminated with Cd. The results depicted that Si NPs positively affected the wheat growth and chlorophyll contents over the control. The Si NPs diminished the oxidative stress and positively affected the antioxidant enzyme activity. The Si NPs decreased the Cd concentrations in wheat, especially in grains, and increased the Si concentrations in plants. The Si NPs reduced the Cd contents by 10–52% in shoot, by 11–60% in roots, and by 12–75% in grains as compared with respective controls. The study suggested that the use of Si NPs may be a tool for reducing the Cd toxicity in wheat and declining its concentration in grains. Thus, Si NPs application by seed priming method might be helpful in increasing plants biomass and yield while reducing the oxidative stress and Cd uptake in wheat grains.
from Climate Change Skeptic Blogs via hj on Inoreader http://bit.ly/2W11ZX2
Eco-sneakers are still killing the planet, just a little slower [Study]

from Climate Change Skeptic Blogs via hj on Inoreader http://bit.ly/2FAnuJh
Subscribe to:
Posts (Atom)