
With the end of December, Arctic ice is rebuilding in the dark up to its annual maximum before the beginning of dawn in March. Since many of the seas are already at their maximum extents, the coming months will only add about 2M km2 to the approximately 13M km2 of ice in place.

The map above shows the remarkable growth of Bering Sea ice in December. The Bering ice extent grew from 57k km2 to 459k km2 yesterday, exceeding the March Bering maximum of 451k km2. Okhotsk has grown ice more slowly, now at 347k km2 slightly below average. Note Chukchi Sea north of Bering froze completely as of day 350.
The regrowth of Arctic ice extent was slower than usual until recently. After showing resilience in September, ending higher than 2007, ice growth lagged in October, then recovered in November and kept pace with average through most of December.

In December, 2018 ice extent has grown by close to 11 year average until the last 10 days. As of Dec. 31, 2018 ice extent is ~300k km2 (2%) less than average (2007 to 2017). The chart also shows the variability of ice extent over the years during this month. 2007 ramped up to match average, while 2017 was almost 200k km2 lower than 2018 at year end. SII is showing 2018 lower than MASIE 2018, closely matching MASIE 2017.

The table below shows this year compared to average and to 2017 for day 365. Since several years in the dataset were missing day 365, I am making the comparison a day later.
| Region | 2018365 | Day 365 Average | 2018-Ave. | 2017365 | 2018-2017 |
| (0) Northern_Hemisphere | 12805066 | 13107229 | -302163 | 12628187 | 176880 |
| (1) Beaufort_Sea | 1070498 | 1070245 | 253 | 1070445 | 53 |
| (2) Chukchi_Sea | 966006 | 963990 | 2016 | 943883 | 22124 |
| (3) East_Siberian_Sea | 1087137 | 1087133 | 5 | 1087120 | 18 |
| (4) Laptev_Sea | 897845 | 897842 | 3 | 897845 | 0 |
| (5) Kara_Sea | 773183 | 889865 | -116682 | 892689 | -119507 |
| (6) Barents_Sea | 261190 | 437725 | -176534 | 331819 | -70629 |
| (7) Greenland_Sea | 522009 | 582349 | -60340 | 555757 | -33748 |
| (8) Baffin_Bay_Gulf_of_St._Lawrence | 1069626 | 1023935 | 45691 | 978074 | 91552 |
| (9) Canadian_Archipelago | 853337 | 853059 | 279 | 853109 | 229 |
| (10) Hudson_Bay | 1260903 | 1230818 | 30086 | 1260838 | 66 |
| (11) Central_Arctic | 3194383 | 3206157 | -11774 | 3191526 | 2858 |
| (12) Bering_Sea | 458758 | 422870 | 35888 | 194350 | 264408 |
| (13) Baltic_Sea | 20842 | 35624 | -14782 | 13345 | 7497 |
| (14) Sea_of_Okhotsk | 347016 | 375834 | -28818 | 336595 | 10421 |
The main deficit to average is in Barents and Kara Seas on the Atlantic side, partly offset by surpluses in Hudson and Baffin Bays and in Bering Sea on the Pacific side. Note the huge increase in Bering ice this year compared to 2017. This coincides with the disappearing warm water Blob in the North Pacific, as reported by Cliff Mass.The Canadian and Siberian sides are locked in ice, with sizable surpluses in Baffin Bay and Okhotsk Sea.
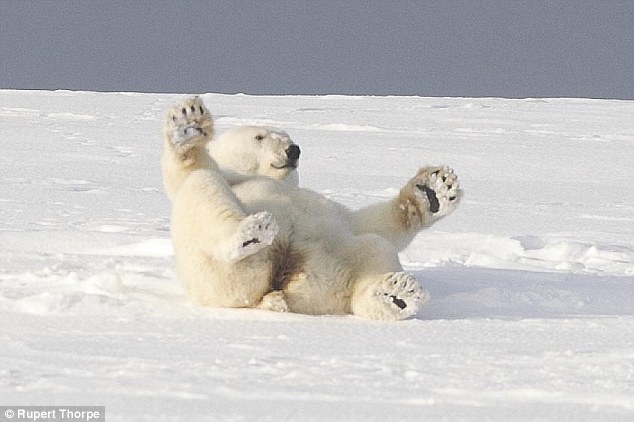
No one knows what will happen to Arctic ice.
Except maybe the polar bears.
And they are not talking.
Except, of course, to the admen from Coca-Cola

Summary
There is no need to panic over Arctic ice this year, or any year. It fluctuates according to its own ocean-ice-atmospheric processes and we can only watch and be surprised since we know so little about how it all works. Judah Cohen at AER thinks much greater snowfall in October and since will make for a very cold winter. We shall see. It is already adding more mass to the Greenland ice sheet than in previous years.

See Natural Climate Factors: Snow
In any case, the early and extensive ice in the Canadian Arctic regions was well received by our polar bears.
from Climate Change Skeptic Blogs via hj on Inoreader http://bit.ly/2Rpy8YL


No comments:
Post a Comment